Overview of the Free Membership Features
The Free Membership consists of 3 features:
- Access to stocks ranked from 6th to 10th on the Everest Screener.
- Analysis of the stocks ranked from 6th to 10th by clicking on their symbol in the Everest Screener table.
- Analysis of a company randomly selected by the platform on the Everest Analyzer page. Every day the platform selects a new company and shows its analysis for free.
We are going to show practical examples of how they can be used.
Finding bargains with the Everest Screener
Bob is a value investor who likes to make his analysis using Warren Buffett’s four pillars of a reasonable investment:
- Invest only in businesses you can understand
- Invest in companies that have an economic MOAT
- Invest in companies that have a good management team
- Invest in undervalued companies
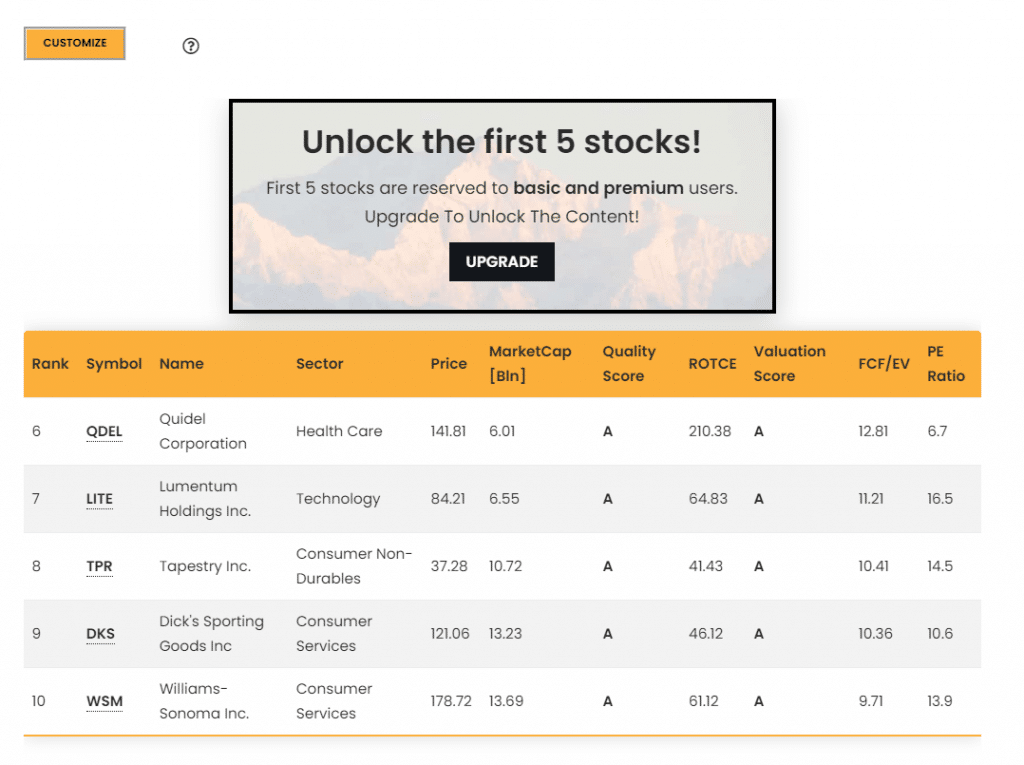
Bob has subscribed to the Everest Formula to get some ideas about stocks to invest in. When he opens the Everest Screener today, he finds the following companies:
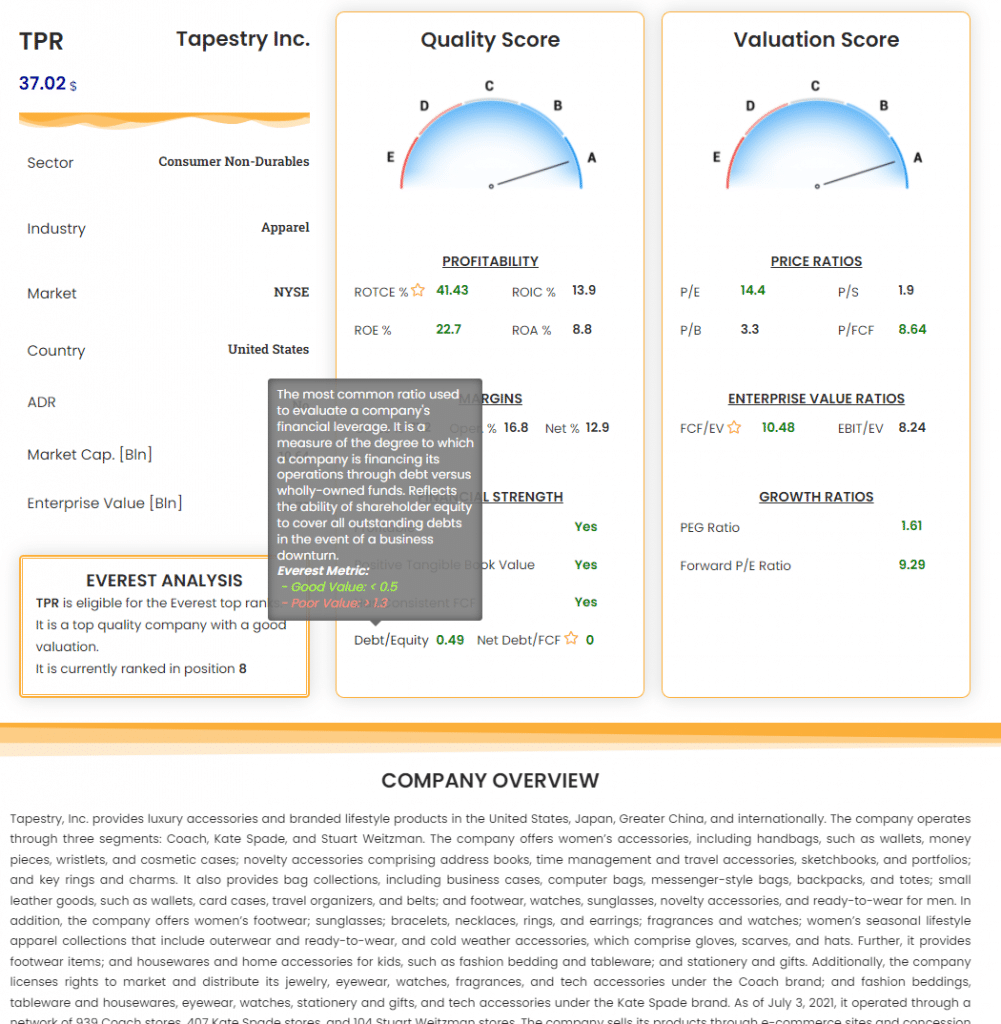
These companies seem all good and undervalued businesses, so he clicks on each of the symbols to understand what these companies do. When he clicks on TPR and reads the company overview, something catches his eye: TPR is the company that produces the Coach’s handbags and goods that he often gives to his wife as a Birthday and Christmas gift!
The business is relatively straightforward: they make money selling apparel and accessories worldwide through 3 brands: Coach, Kate Spade, and Stuart Weitzman. Bob starts to look at some presentations and annual reports directly from the company investors’ website and understands that it is a strong company that produces high-quality products and is expanding worldwide.
Bob also knows they have a strong brand moat: his wife, like thousands of people in the world, prefers Coach’s handbags because they like the Coach brand and the quality of all their products.
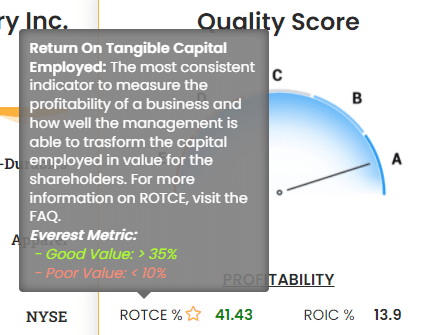
For the third principle (to have a good management team), he takes a look at the Everest Analyzer in the Quality Score section: the company is managed with a minimum amount of debt, and the management is also capable of allocating their assets very well, having a good ROIC and a very good ROTCE. Next, he clicks on all the metrics proposed by the Everest Formula, using the tooltips that appear to understand better what their meaning is and what values are considered good for each metric.
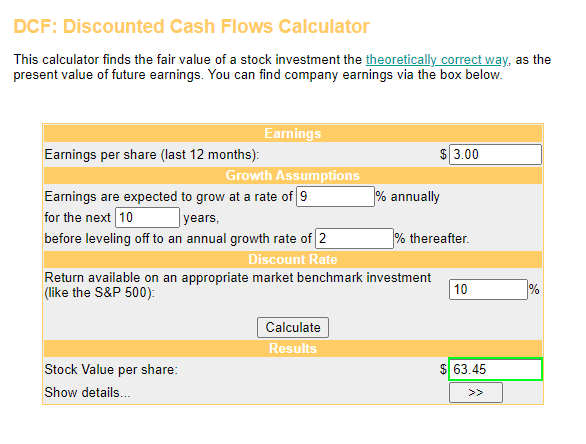
Lastly, he wants to understand its valuation: the Everest Analyzer Valuation Section comes in handy: all the valuation metrics look good, and the TPR price seems to underestimate its actual value. But Bob wants to go more in-depth and use the Discounted Cash Flow model to make a precise valuation of the company: using one of the thousands of free tools available on the web, he fills all the form fields using the last company financial report or a financial website that collects fundamental data, like Yahoo Finance.
He inserts 9% as the company’s expected growth rate (found on the Yahoo analysis page). Even if analysts are usually wrong, Bob knows that it is a plausible value because he compares it with the historical growth rate of the company and the idea of the future perspectives that he built while looking at the reports and presentations), a 2% perpetual growth rate (a typical conservative value) and a 10% discount rate (i.e., the average annual return that Bob requires for his investments). The output looks good: with a value per share of 63.45$ and a current price of 37.02$, the stock seems currently about 40% undervalued.
Bob has just found the right stock for him!
Getting new ideas and avoiding value traps with the free daily analysis
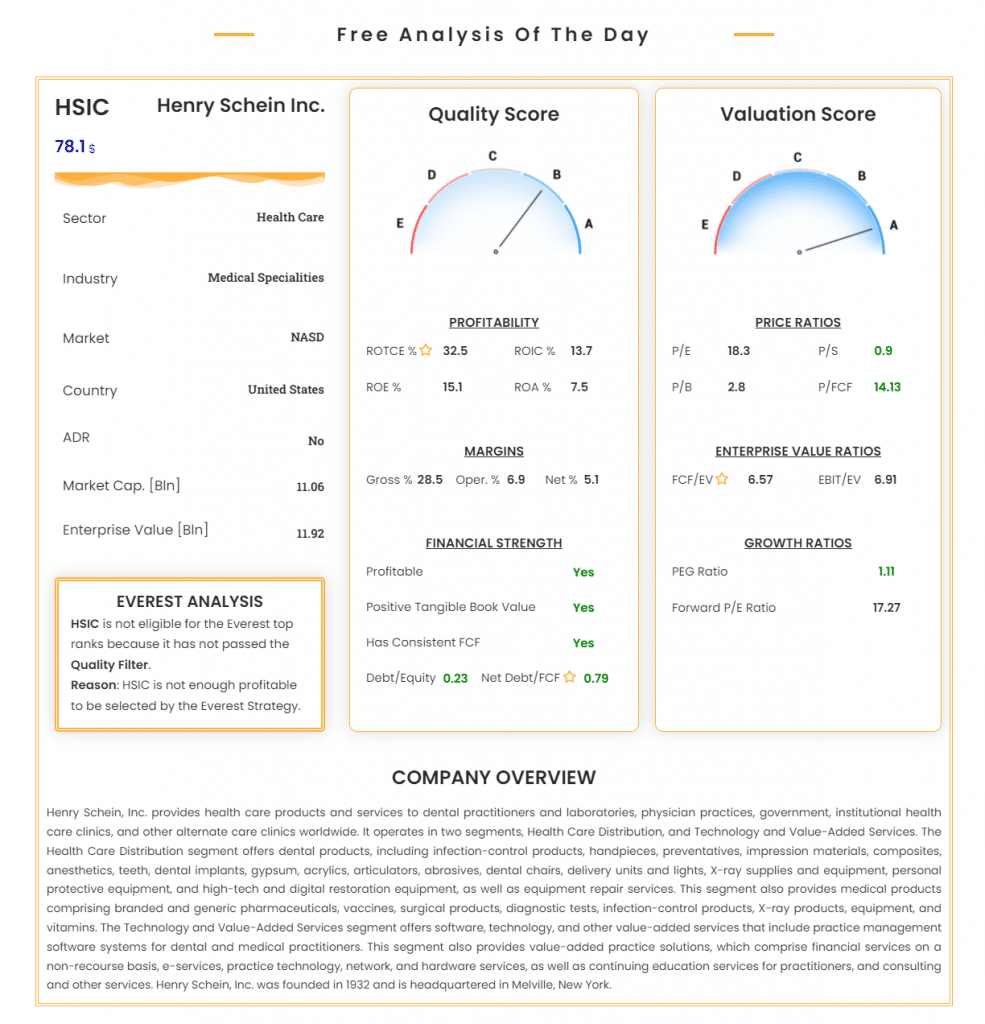
Alice is a young investor who likes to learn new analysis techniques and discover new companies daily to invest in. She subscribed to the Everest Formula to understand how a company can be valued. Every day, she opens the Everest Analyzer page to find out what the daily analysis is. Today we have HSIC stock:
HSIC seems not profitable enough to be selected by the Everest Formula as a top-ranked stock for the Everest Strategy. Anyway, HSIC has good profitability metrics, an excellent financial position, and looks undervalued. The Quality and Valuation scores of respectively B and A point out that it is an outstanding stock that Alice will consider for a deep dive, using the instruments to do a qualitative valuation, i.e., understanding the business and the potential future growth.
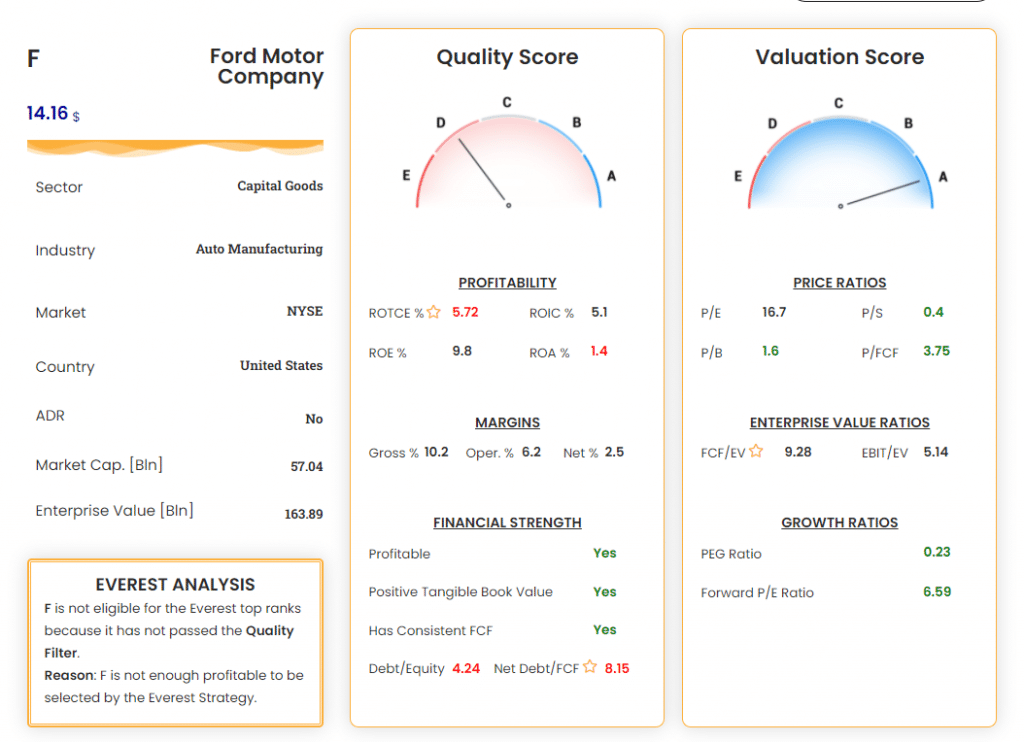
The next day Alice finds “Ford Motor Company”, a stock that she had already heard of in a value investing Reddit group, in which people commented on the stock with sentences like “Ford is undervalued, with a Price/Sales ratio of 0.4 and a forward PE ratio of just 7!”
Looking at the Analyzer, Alice realizes the harsh reality: Ford has a massive amount of debt and generates too little profit for the assets it needs to maintain its business due to the high competition in the Auto Manufacturing sector. While Ford seems cheap, it is also a poor-quality stock, making it not appealing to a value investor. Even if the stock price can go anywhere in the short term, it’s difficult to say that it is a good bargain for the long term.
Alice has realized that Ford is a value trap.

