- The Premium Membership helps intermediate and advanced users to find the best opportunities across the stock market, through the advanced filters of the Everest Screener and the Everest Analyzer.
- The Everest Screener Advanced Filters let you customize the ranking system of the Everest Formula, in order to find stock ideas within specific sectors and broaden/restrict your research to Small Cap/Big Cap companies.
- The Everest Analyzer creates a scoreboard of all the stocks available in the U.S. market, and lets you check the stocks you are interested in, both from a quality and a valuation perspective, in order to make the right decision as a value investor.
Sei interessato ad utilizzare le funzioni premium qui descritte? Unisciti a noi!
Panoramica delle caratteristiche dell’abbonamento Premium
The Premium Membership still includes the free and basic features, like “apply the Everest Strategy” and “receive the weekly newsletter“, with the best stocks of the moment.
Inoltre, ecco un riepilogo delle funzionalità esclusive riservate agli utenti Premium:
- Everest Screener Filters: Access to the top 50 ranked stocks, fully customizable ranking system to get the best stocks within specific sectors and capitalizations.
- Everest Analyzer:Accesso completo all’analisi di più di 5000 titoli, con cruscotto di valutazione e qualità.
- Supporto Premium: Risposta entro 1 giorno lavorativo.
Andremo ora a fare una descrizione approfondita delle prime due funzionalità, con esempi pratici e reali.
Filtri avanzati dell’Everest Screener
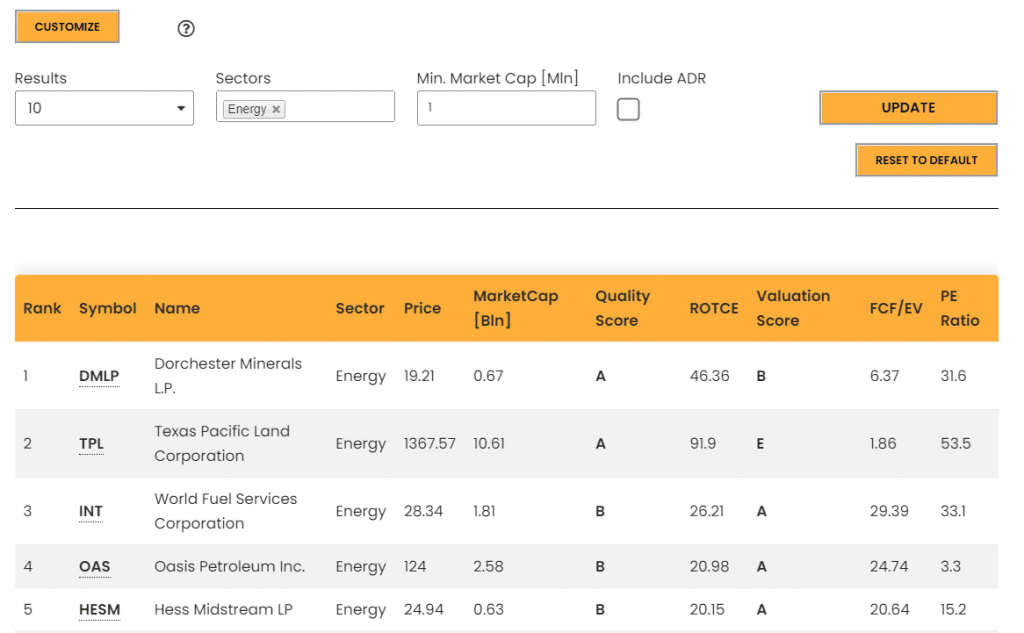
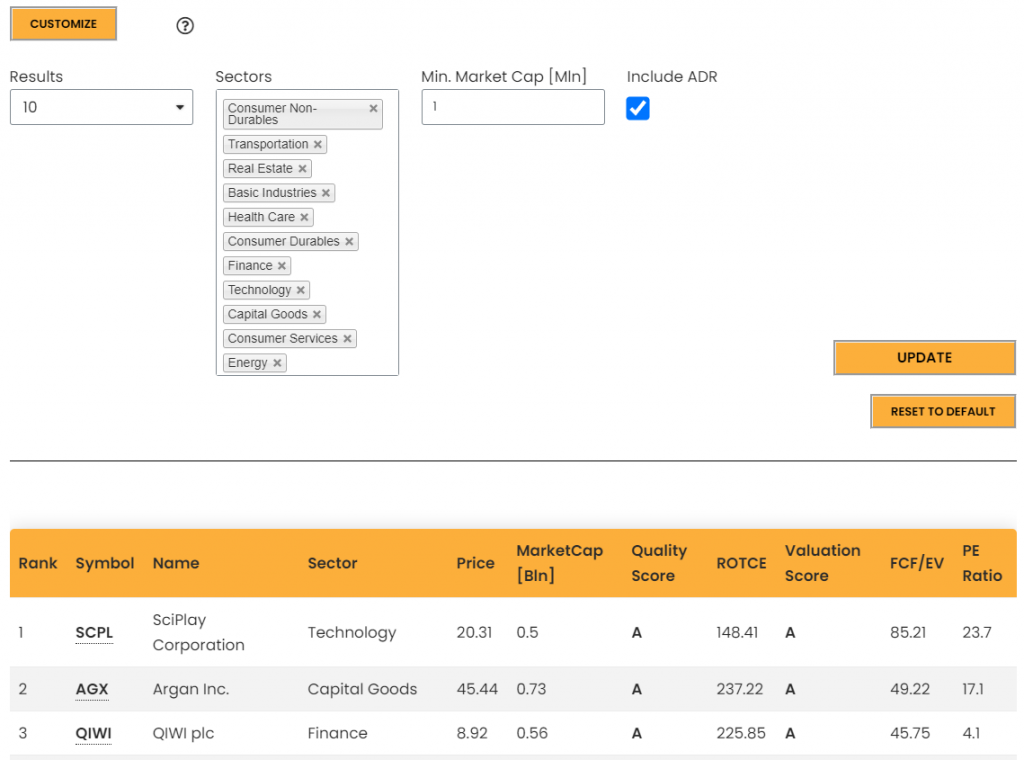
The “Customize” button lets you open the advanced filters section, where you can apply the following filters:
- Results: By default the Screener shows the first 10 ranked stocks, but you can broaden your search by selecting up to 50 results. This is useful if you want to apply the Everest Strategy with more than 10 stocks, or if you simply want to get more results for your customised search.
- Sector: You can get the best stocks of a specific sector, or combine multiple, to get a personalized rank based on sectors in which you are more confident or you think they will outperform the broad market in the next future.
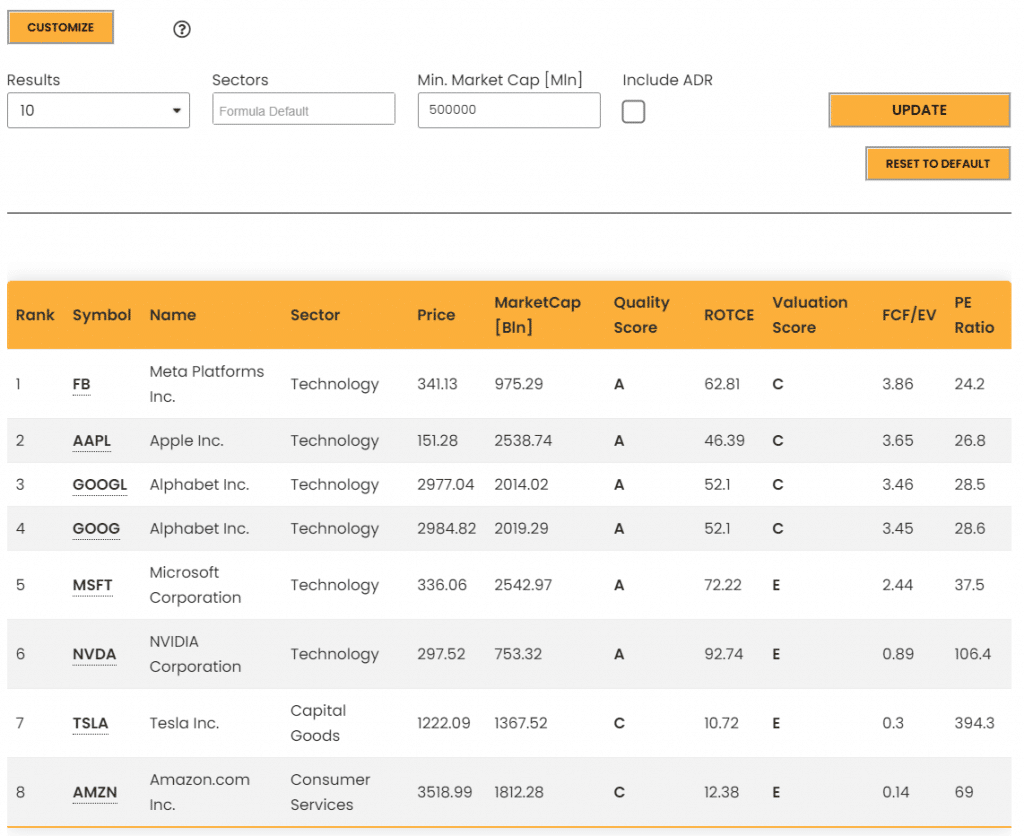
- Min. Market Cap: Everest Formula usa una procedura proprietaria per determinare la dimensione minima delle aziende da considerare per strategia Everest, ma è possibile selezionare una soglia personalizzata per ottenere una classifica che include solo le big cap, le big e medium cap, o qualsiasi azienda, di ogni dimensione. Per esempio, selezionando “1” come Min. Market Cap, includerai tutte le aziende nella tua ricerca, da 1 milione di capitalizzazione (il minimo) alle aziende più grandi. Selezionando 1.000.000 includerai solo le aziende più grandi, con almeno 1 trilione di Market Cap.
- Include ADR: By default foreign stocks (i.e. whose main market is not NYSE, Nasdaq or AMEX) are discarded by the Everest Formula because financial data are more subject to errors for those stocks, due to currency conversions and other factors. But premium users can include them and make their own research to confirm the quality of their data, by enabling this flag.
Here are presented some common use cases:

Everest Analyzer
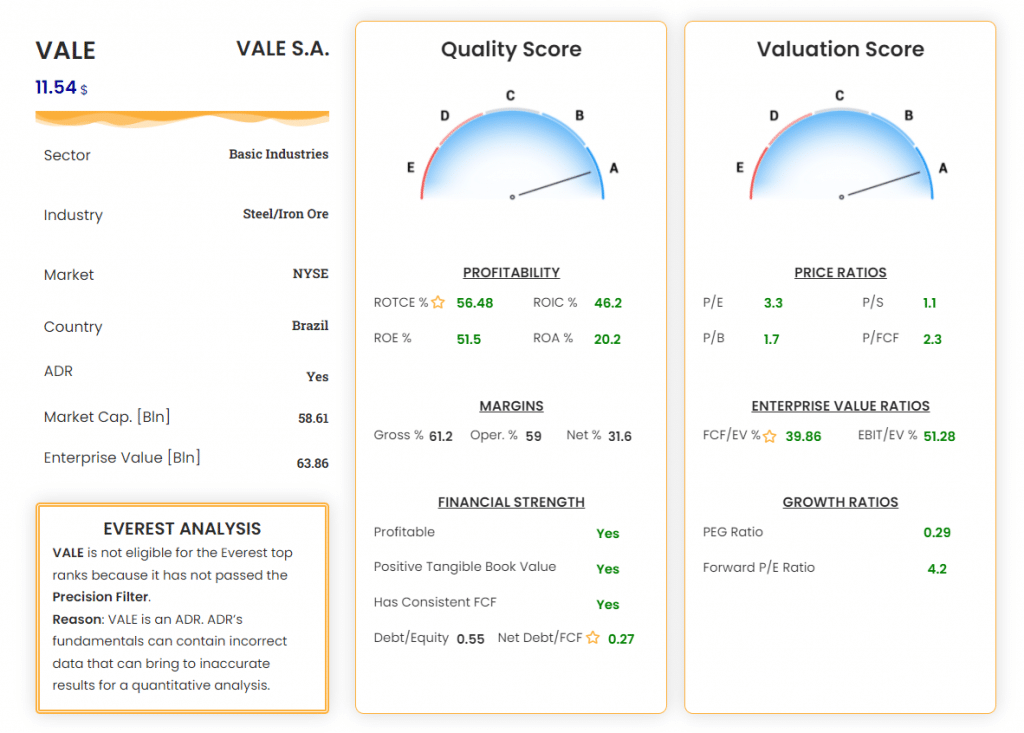
The Everest Analyzer is a powerful tool to get a snapshot of the stock’s current situation, and its underlying company. It lets investors understand the weakness of stocks through the flagging system, pointing out the aspects that need further analysis.
L’analisi può essere suddivisa in 4 sezioni:
- Nome del titolo e Ticker, prezzo e informazioni generali:Questa sezione fornisce una panoramica del titolo e della società sottostante. Una panoramica completa dell’azienda che descrive il suo modello di business è anche disponibile sotto l’Analyzer.
- Everest Analysis widget: The Everest Formula processes the stock through a 4-step validation, and in this widget you find the outcome, that can be:
- Blocco nel primo filtro: L’azione non ha superato il filtro di precisione. Maggiori dettagli sono forniti nella sezione dei motivi.
- Blocco nel secondo filtro: L’azione non ha superato il filtro di qualità. Maggiori dettagli sono forniti nella sezione dei motivi.
- Blocco nel terzo filtro: L’azione non ha superato il filtro di valutazione. Maggiori dettagli sono forniti nella sezione dei motivi.
- Azione idonea: L’azione ha superato tutti i filtri ed è classificata in base al rank sulla valutazione (4° step). La posizione della classifica è data all’interno del widget.
The Everest Analysis widget is useful to immediately understand why the stock is discarded (if discarded) by the Everest Formula and dig more into the reasons.
- Cruscotto della qualità:Un insieme di metriche che rappresenta la qualità complessiva dell’azienda. Il cruscotto è composto da 3 sezioni:
- Redditività:Come l’azienda è in grado di trasformare il suo capitale in profitti. Ogni metrica dà una risposta da un punto di vista diverso.
- Margini:Metriche utili per capire il MOAT dell’azienda e la pressione dei concorrenti.
- Financial Strength: A look at the company’s balance sheet and the ability of the management to get profits without incurring in heavy debt.
- Cruscotto di valutazione:Un insieme di metriche che rappresenta la valutazione delle azioni. Il cruscotto è composto da 3 sezioni:
- Price Ratios: Classic metrics that compare the price of the stock with fundamental aspects of the company’s operations, like revenue (P/S), income (P/E), equity (P/B) and free cash flow (P/FCF).
- Indicatori Enterprise Value:L’Enterprise Value, a differenza del semplice prezzo, tiene conto del livello di indebitamento dell’azienda, e può dare migliori indicazioni sul vero valore di un’azione.
- Growth Ratios: Valuation metrics that take also into account the expected growth of the company. Useful for companies that rely considerably on their growth.
Sistema di segnalazione: Ogni metrica dei cruscotti di qualità e valutazione è valutata da regole generali che giudicano un’azienda in quella specifica metrica. I valori sono colorati di verde, neroo rosso, indicando che si tratta di un buon valore, un valore standard o un valore scarso per il titolo.

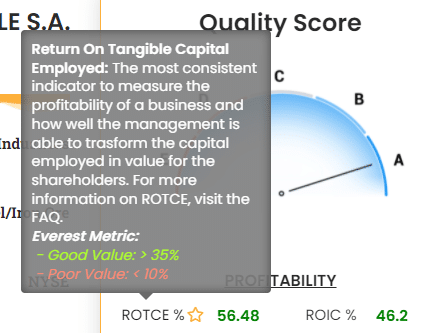
Metric Tooltips: Each metric has an associated tooltip that appears when tapping or hovering on the metric itself. The tooltip shows a complete description of the metric, how it can be useful and what are the threshold values that make the metric considered good or poor for the company.
Esempi di analisi
Mostriamo due esempi in cui l’Everest Analyzer si dimostra un potente strumento per identificare i punti deboli e indicare agli investitori la giusta direzione.
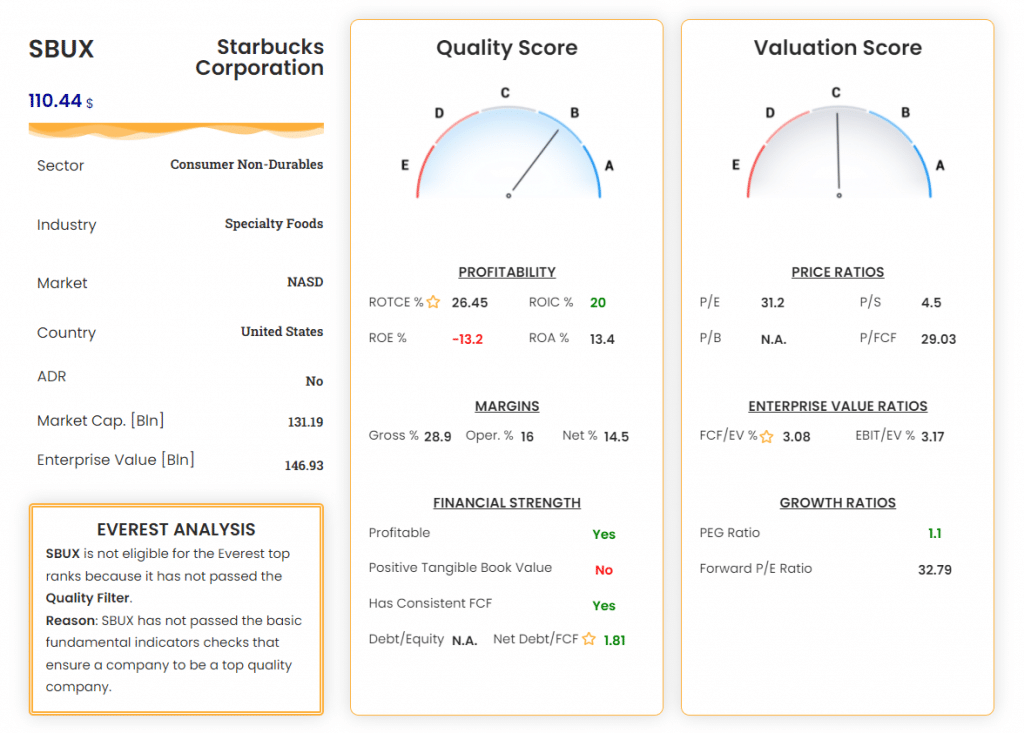
Starbucks Corp. – SBUX: L’analisi Everest evidenzia la presenza di possibili problemi (come investimento) dal punto di vista della qualità. Scavando nelle metriche del cruscotto della qualità, notiamo che Starbucks ha una buona redditività, un grande MOAT (indicato dagli alti margini rispetto ai peers del suo settore), un debito contenuto, ma un patrimonio netto negativo, evidenziato dal ROE negativo e dal tangible book value negativo.
A questo punto l’investitore dovrebbe cercare di trovare la ragione di questa anomalia, e si imbatte in alcuni articoli che ne spiegano la ragione:
“In Starbucks’ case, it appears to be from two in particular. Firstly, the company has a lot of leverage: it has around $37.2bn in total liabilities and only $29.4bn in total assets. Secondly, the company has been paying out more than it has earned. This can be attributed to the company’s generous buybacks and dividends. Despite only earning a total of $9.03bn net income over the 3 years to September 30 2020, the company has paid out $5.4bn in dividends and spent $19bn buying back company stock in that time. While this has probably pleased many shareholders because it’s resulted in a nearly 100% total return (including dividends) in only 2 years, it is not sustainable in our view.“
Questo non è un buon comportamento per un investitore di lungo termine e dovrebbe sollevare un considerevole segnale di allarme.
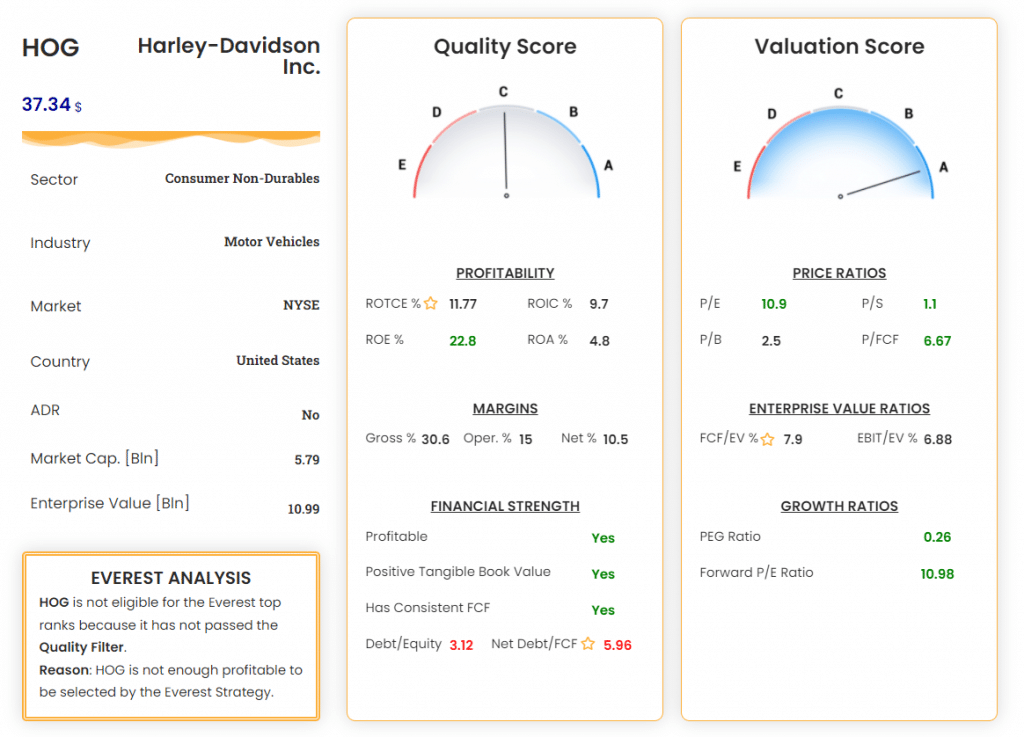
Harley-Davidson Inc. – HOG: Harley-Davidson is an iconic motorcycle brand of the 80’s and 90’s whose stock appears to be extremely cheap for the current valuation. A negligent investor could be attracted by the extreme low price ratios. Here the Everest Analysis shows two important aspects: a non-optimal profitability (ROTCE and ROA are on the lower threshold) and a remarkable amount of debt. Putting these aspects together with the continuous revenue decrease over the last decade, make the HOG stock an high risk stock that the investor should carefully inspect before making an investment.
Conclusioni
The premium membership provides two powerful tools that help investors to find the best stocks in the market and to make their investment decisions become aware of every aspect of a company. if you are interested in using the premium features described here, please consider Join now.


